Vp/Vs in Reservoir Characterization
Compressional to Shear Velocity ratio (Vp/Vs ratio) and its importance in formation evaluation and reservoir characterization in sandstone reservoirs
Authors: Amit Ray and Rajeshwaran Dandapani
Theory
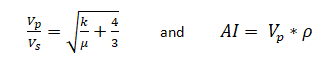
P-wave (Compressional) and S-wave (Shear) velocities for homogeneous, isotropic rocks are expressed as

Where k is bulk modulus, µ shear modulus and ρ density of a rock.
Although the actual rocks are not isotropic and homogeneous, elastic equivalency exists between the two to a great extent in Layered media when the velocities are approximated as Interval, Average and RMS.
Velocity ratio (Vp/Vs) and Acoustic Impedance (AI) can be expressed as
Bulk modulus also called incompressibility quantifies total volumetric stiffness. Shear modulus, on the other hand, defines the rigidity of a material and describes its resistance to shear distortion.
Hydrocarbon effect on Vp/Vs ratio and AI
Let’s discuss how hydrocarbons impact Vp/Vs ratio and AI in the sandstones. Hydrocarbon bearing sands exhibit a decrease in Vp (due to significant reduction of bulk modulus and a moderate reduction of density), but a little increase in Vs (due to a reduction of bulk density). Consequently, the combined effect is considerably lower Vp/Vs ratio in the hydrocarbon bearing sands. This is pictorially illustrated in Figure 1.

Figure 1: Effect of hydrocarbon on AI and Vp/Vs ratio. Adapted from Avseth and Veggeland (2015).
Significance of Vp/Vs ratio in reservoir identification
Now, we will discuss how Vp/Vs ratio behaves in (i) under-compacted and un-consolidated gas sands (ii) moderately compacted and consolidated hydrocarbon sands and (iii) highly compacted hydrocarbon sands relative to the encasing background shales and helps in detecting these sandstone reservoirs.
- In the case of mildly-consolidated gas sands, usually found at shallow depths, both Vp/Vs ratio and AI exhibit lower values when compared to the encasing shales, since Vs in shales is very much lower when compared to sands due to their low rigidity modulus and high densities when compared to sands at shallow depths. In this case, both Vp/Vs and AI help in detecting these gas sands. (Class 3 AVO anomaly)
- For moderately consolidated gas sands, Vp/Vs ratio exhibits lower values when compared to the encasing shales. However, AI of sands exhibit approximately similar values (overlapping range of values) as of the encasing shales. Hence, Vp/Vs ratio acts as an important parameter in detecting these types of gas sands. (Class 2 AVO anomaly)
- In case of highly compacted hydrocarbon sand, Vp/Vs ratio again exhibits lower values compared to the encasing shales. However, AI exhibit higher values for these gas sands relative to the encasing shales. Here also, Vp/Vs ratio significantly help in detecting these type of gas sands. (Class 1 AVO anomaly) (Caution: Vp/Vs ratio contrast, between sands and shales at these depths and levels of compaction, acts more as a lithology indicator than fluid indicator)
(We will discuss “Amplitude Variation with Offset (AVO) and its importance in reservoir characterization” in the coming review series)
Studies from various authors not only indicated Vp/Vs ratio as a good lithology indicator, but also shown its sensitivity to porosity and pore fluid type. Picket’s study (1963) indicated the dependence of Vp/Vs ratio on rock porosity. His analysis showed that Vp/Vs ratio is around 1.6 in low porosity sand, moving towards 1.8 in comparatively higher porosity sand. The study of Gardner and Harris (1968) showed that gas saturated unconsolidated sands exhibit Vp/Vs values <2.0, whereas the water saturated unconsolidated sands exhibit Vp/Vs values > 2.0. Murphy et al. (1992) also showed the dependence of Vp/Vs ratio on clay content and indicated the increase of Vp/Vs ratio with the increase of clay content. Castagna et al. (1985) has reported anomalously low values of Vp/Vs ratio indicative of a tight gas sandstone.
The above studies not only signify Vp/Vs ratio as a good indicator of lithology and clay content, but also illustrates its sensitivity to porosity and pore fluid type. However, one important point has also become apparent here that lower Vp/Vs values do not always represent a better reservoir. Tight gas sand also typically exhibit a lower Vp/Vs compared to that in Shales. Figure 2 shows a cross-plot of Vp and Vs for the Frio formation sandstones, Texas Gulf Coast (Adapted from Castagna et al., 1985), where tight gas sandstone shows anomalously low values of around 1.5.
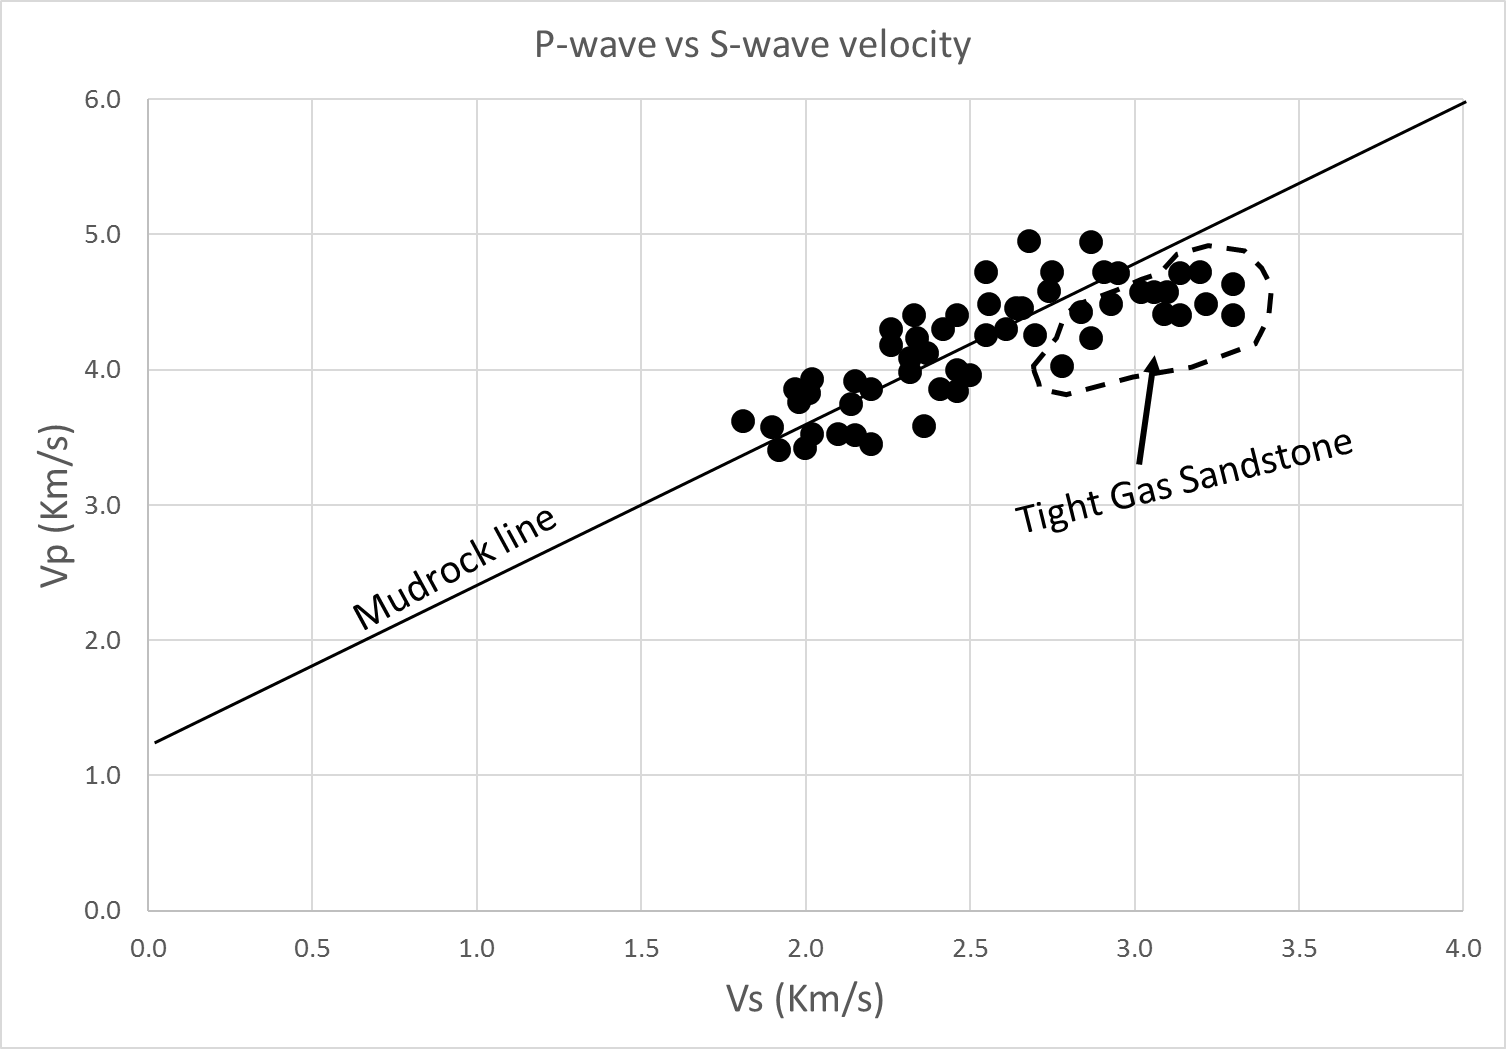
Figure 2: P-wave and S-wave velocities in Frio formation sandstones. Adapted from Castagna et al. (1985).
As we identify and evaluate reservoir zones using Vp/Vs ratio calculated from P-wave and S-wave sonic log data, the next step is to derive Vp/Vs ratio attribute using seismic data. Using pre-stack seismic inversion technique, we can effectively derive Vp/Vs ratio integrating pre-stack seismic data and Sonic-density log curves. Vp/Vs ratio, thus derived, acts as a useful attribute in characterizing the reservoir.
Rock Physics analysis – a prerequisite
However, for effective application of this attribute to reservoir identification and subsequent use in seismic reservoir characterization, we should carry out a rock physics study and cross-plotting analysis using rock physics template (RPT). This will provide a clear understanding of what range of Vp/Vs ratio, we are expecting for the reservoir units and other formations in the study area. This will also help in linking the reservoir properties with Vp/Vs ratio and other elastic parameters and subsequently converting these elastic parameters from pre-stack inversion data.
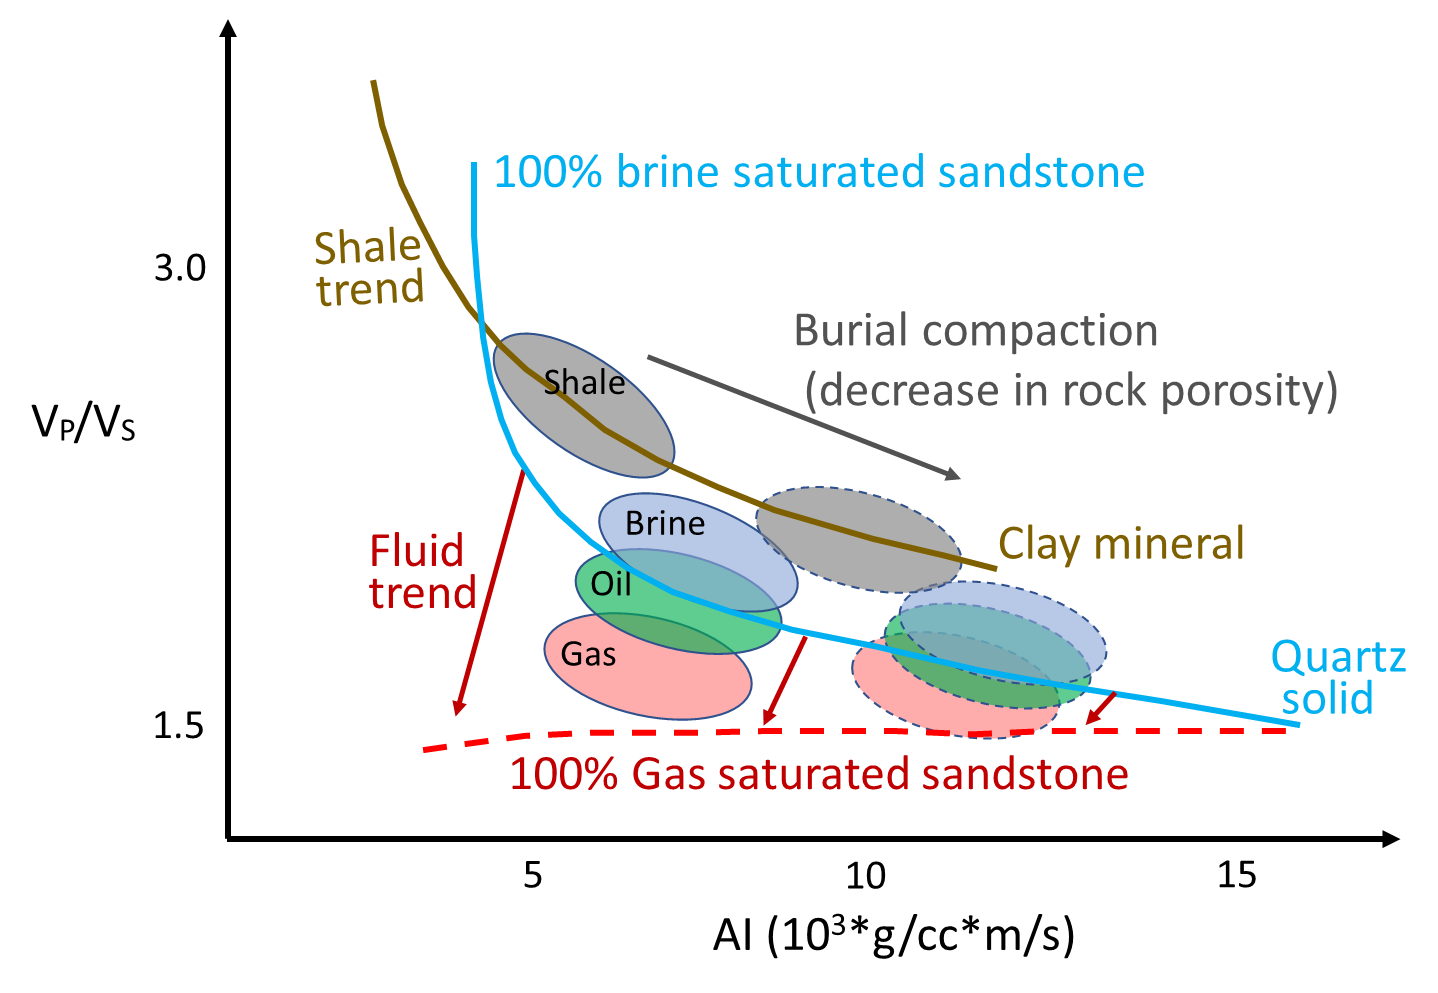
Figure 3: A framework for Rock Physics Template (RPT) in AI vs Vp/Vs space for brine and hydrocarbon saturated sandstones and shales. Adapted from Avseth and Veggeland (2015).
Figure 3 shows an RPT framework in AI and Vp/Vs cross-plot space for brine and hydrocarbon saturated sandstones and shales (Adapted from Avseth and Veggeland, 2015). This template is comprised of models for different expected lithologies and fluid scenarios, calibrated for a given reservoir and in a given sedimentary basin. The plot clearly indicates noticeable sensitivity of Vp/Vs with the change in lithology, clay content and fluid type and also burial compaction to some extent. AI of course exhibits a greater sensitivity to the burial compaction and rock porosity. These templates are very useful in understanding the response of the elastic parameters (Vp/Vs and AI in this case) to the litho-fluid change and variation in reservoir properties. This in-turn helps in interpreting the reservoir quality and characteristic with the help of the elastic parameters such as VP/Vs and AI, derived from the well log and seismic data.
References:
Avseth, P., and Veggeland, T., 2015, Seismic screening of rock stiffness and fluid softening using rock-physics attributes, Interpretation, 3(4), SAE85-SAE93.
Avseth, P., and Veggeland, T., 2015, Seismic screening of Hydrocarbon Prospects using Rock-Physics Attribute, AAPG Geoscience Technology Workshop, Sixth Annual Deepwater and Shelf Reservoir, Houston. (Search and Discovery Article #41608, 2015)
Castagna, J. P., Batzle, M. L. and Eastwood, R. L., 1985, Relationships between compressional-wave and shear-wave velocities in clastic silicate rocks: Geophysics, 50, 571-581.
Gardner, G.H.F., and Harris, M.H., 1968, Velocity and attenuation of elastic waves in sands: Society of Professional Well Log Analysts, Transactions, 9th Annual Log Symposium, p. M1–M19.
Murphy, W., Reicher, A., and Hsu, K., 1992, Modulus decomposition of compressional and shear velocities in sand bodies: Geophysics, v. 58, p. 227–239.
Pickett, G. R., 1963, Acoustic character logs and their applications in formation evaluation: J. Petr. Tech., 15, 650-667.